Donate
The Cape Breton Mesonet provides live and archived weather data for Cape Breton Island and parts of mainland Nova Scotia. It's an open-source platform, free for everyone to use.
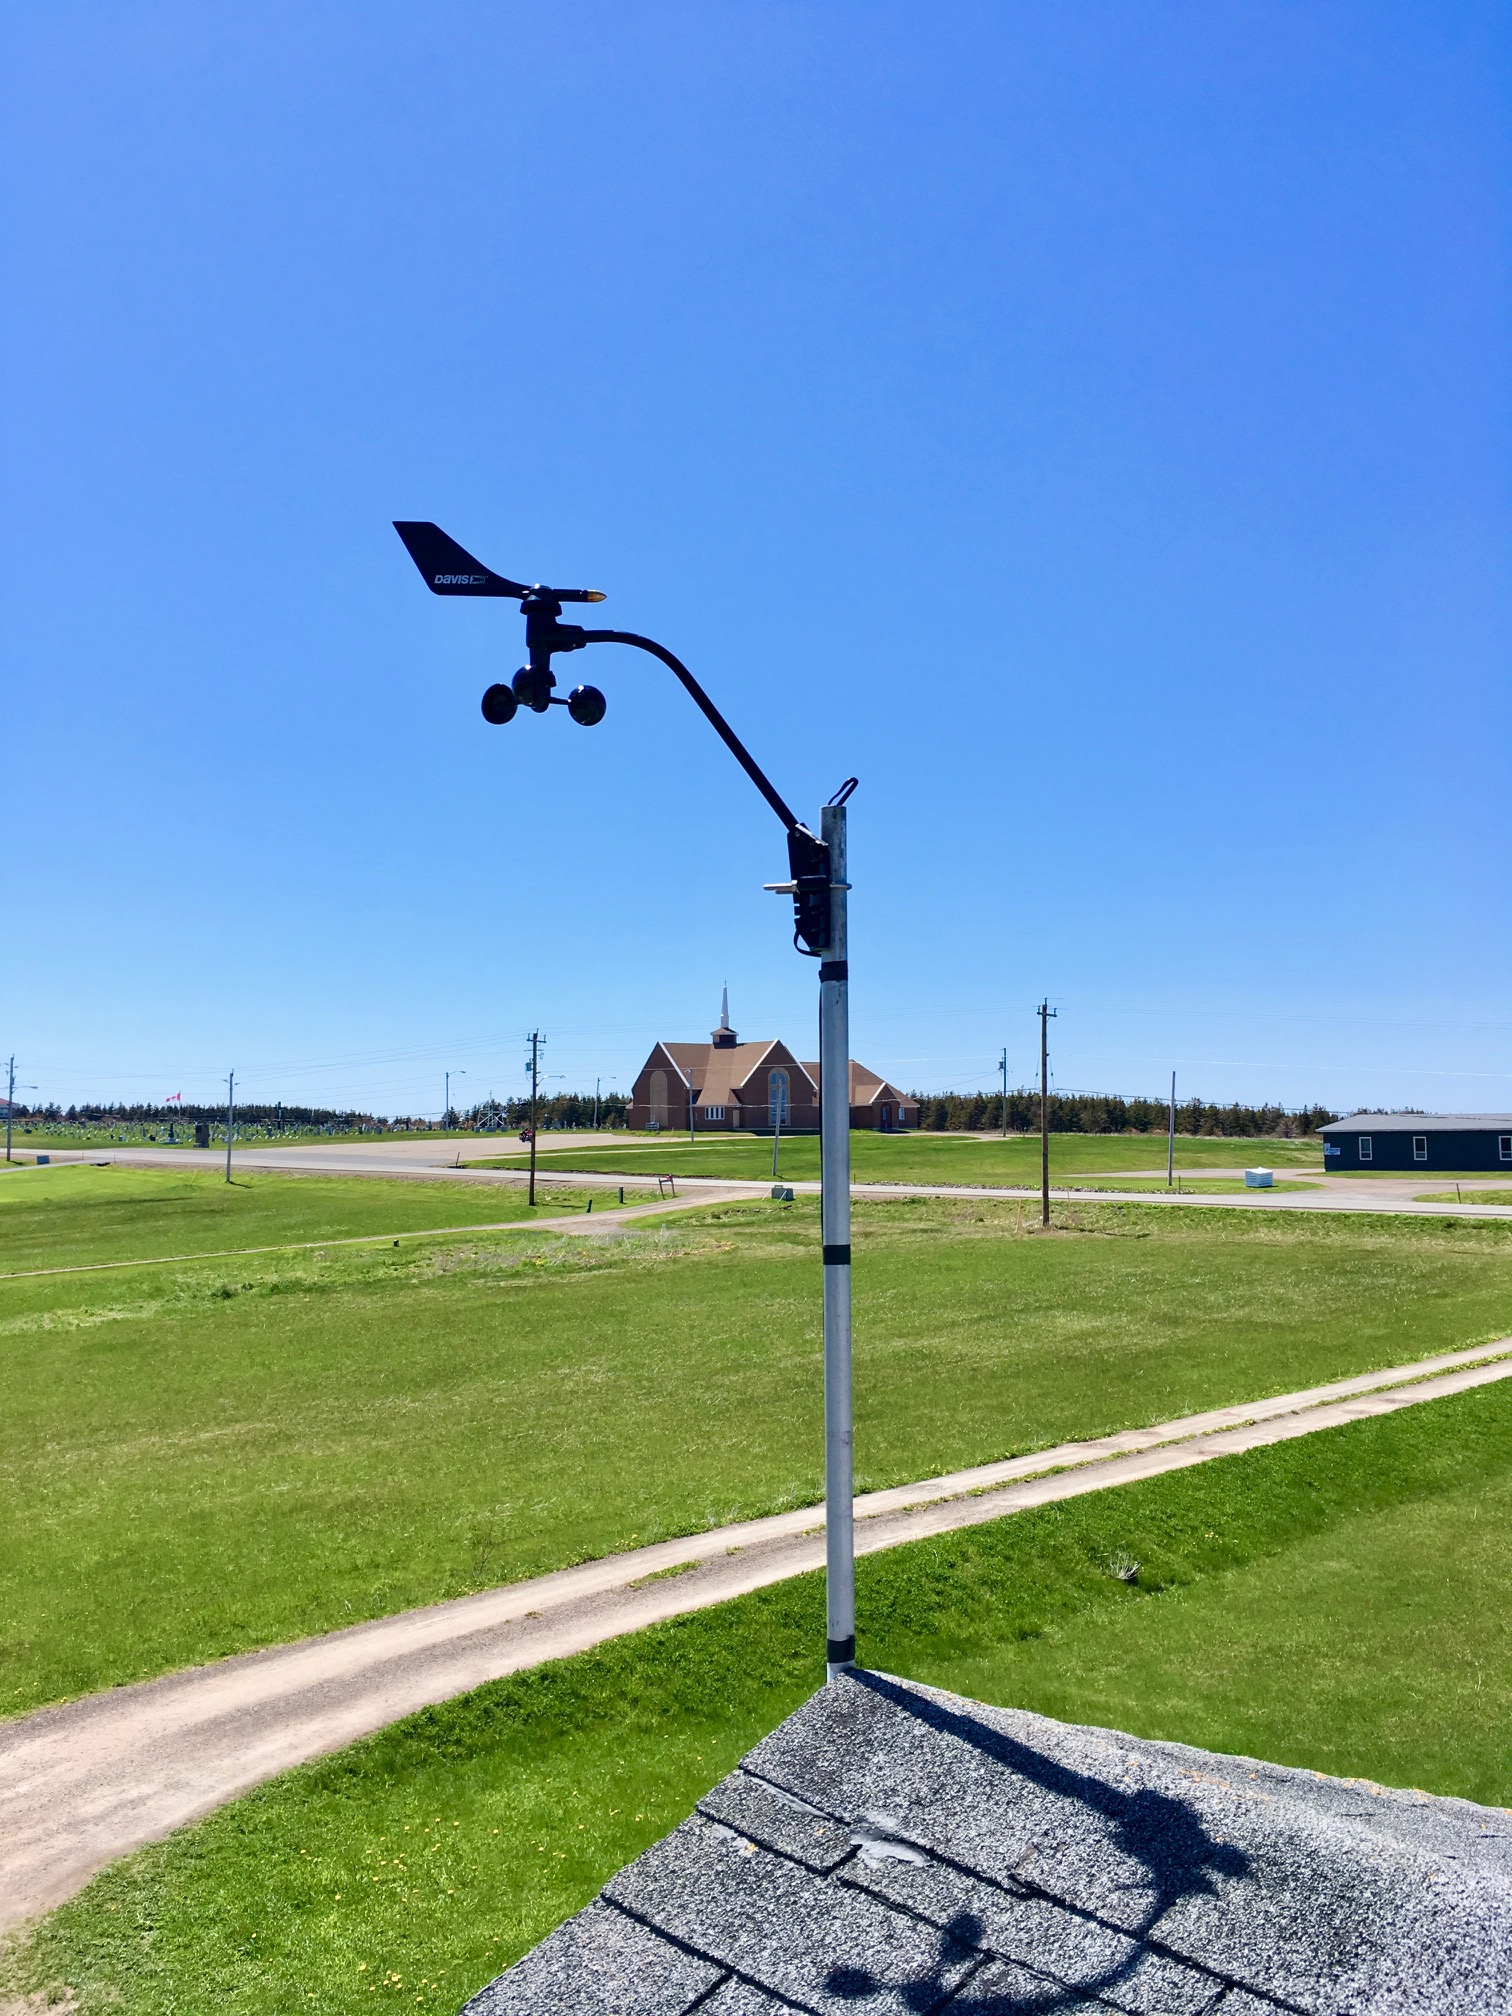 The mesonet has grown exponentially over the last several years and maintenance costs have risen along with that. Normal wear and tear on weather instruments require certain sensors to be replaced every 3-4 years. For example, wind sensors are fully exposed to the elements and often the first to fail. The wind cups (which measure speed) spin millions of times per month.
Donations would help offset the personal cost of maintaining sensors in the mesonet. This will help to ensure that proper sensor maintenance is performed at regular intervals, resulting in consistent, accurate weather data for all weather stations on the network. Any help, no matter how large or small is greatly appreciated.
Thank You
Donation Links
About the Map
Temperature/Wind Icons
The numeric label and circle colour indicate the current temperature. The direction arrow indicates the wind direction.

A longer barb on the direction arrow indicates a wind speed of 10km/h and a shorter barb indicates 5km/h. So, the example above would indicate about 15 km/h.

A flag indicates 50km/h.
Colours
View the colour scale for the active layer by clicking on the legend widget on the bottom right corner of the map.
Rainfall
The "visual" rain layer displays a proportionally sized circle for each station, corresponding to the rainfall amount, while the "numeric" layer displays the full number resolution.